|
#1
●
07-27-2021, 05:28 PM
| ||||||||
 My Rank: MASTER SERGEANT Poster Rank:578 mc² Join Date: Aug 2009 Posts: 1,699 Mentioned: 1 Post(s) Quoted: 299 Post(s)
| ||||||||
|
Recent and Historical Waterlevels Together with the Calculated Discharge
recent and historical waterlevels together with the calculated discharge at measurepoint AltenAhr, Germany This is a work in progress, but lemme show you that you cannot claim a 100 year flood, when yuou don't base the official danger line on data which is shorter than 100 years, and providing prove of this lack of diligence, and further diggin in older sources which lay bare a path of destruction dating from 1348. Indeed, records from that ancient time, but the problem is there were no measure stations. And through the last century many meause posts were washed away, so what do we have left? Just go to the ancient records, which were compiled in the 1840 - 1960, but then forgotten it seems... A mistake? I'll post progressively results of my investigation when I have time, but here are some telling graphs... 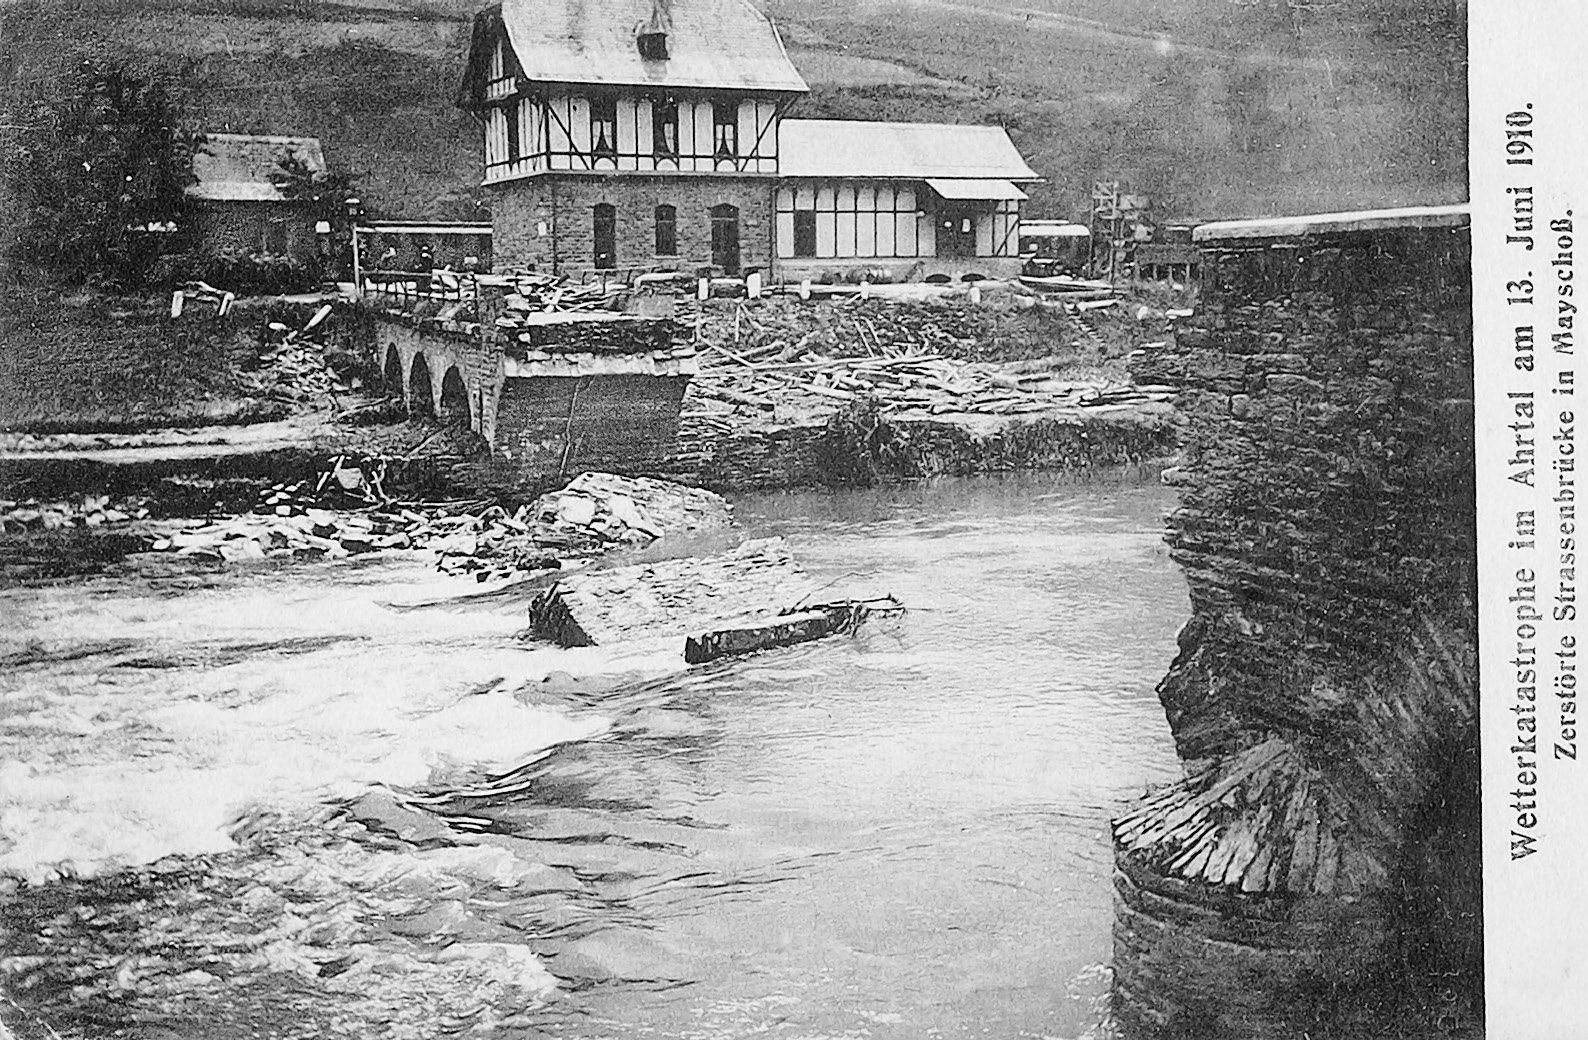 · 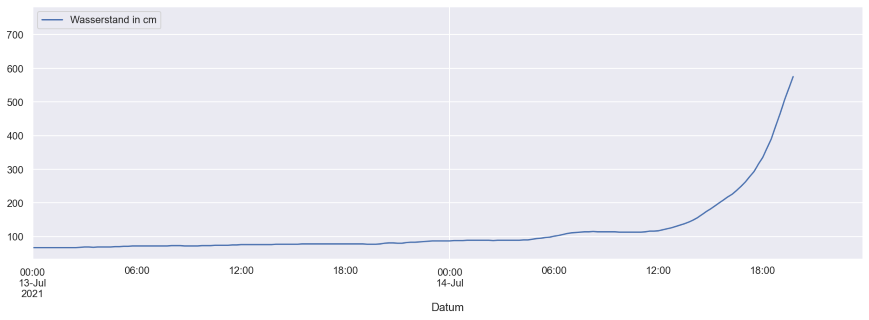 · 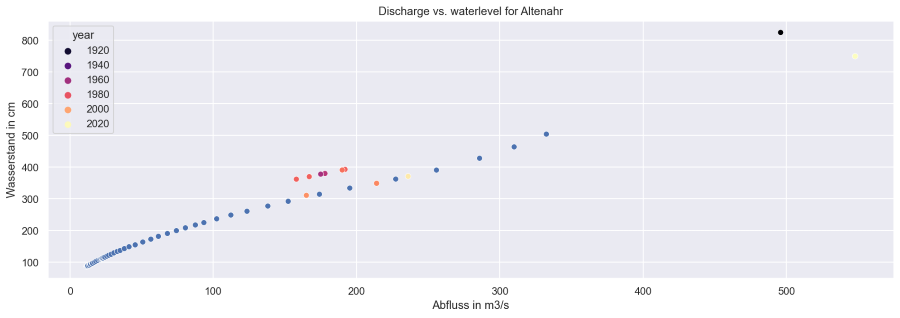 · |
|
#2
●
07-27-2021, 05:49 PM
| ||||||||
| My Rank: MASTER SERGEANT Poster Rank:578 mc² Join Date: Aug 2009 Posts: 1,699 Mentioned: 1 Post(s) Quoted: 299 Post(s)
| ||||||||
|
Re: Recent and Historical Waterlevels Together with the Calculated Discharge
The first picture is a remake of the recent situation, only that the bridge is now totally washed away Why? Wood logs and debris in the raging water make havoc amongst bridges. 2nd: the graph of the measure station, washed away, but it goes to 7.75 in reality, but you only read an estimation of +- 700 mm 3rd: the result of merging data till 1946 with data of present and data from the lesser than 2021 flood of 1910, which was almost alike as you can see. If you prolonge the 2 lines, it makes sence cos the river has got some leeway in the last decades. The upper white dot is the latest flood (but not the max water level, as I dont have discharge yet!) But there was once a bigger monster: the flood of 1804. Just cos of lack of a decnt comparable water level up till now, I'm researching to get a decent water level... but the discharge was calculated, at a location not AltenAhr, 1200 m³/sec. That is off my chart... for the moment, untill I get comparable data for discharge and measure location. Stay put |
|
#3
●
07-31-2021, 03:34 PM
| ||||||||
| My Rank: MASTER SERGEANT Poster Rank:578 mc² Join Date: Aug 2009 Posts: 1,699 Mentioned: 1 Post(s) Quoted: 299 Post(s)
| ||||||||
|
Re: Recent and Historical Waterlevels Together with the Calculated Discharge
so I found a high water markings piccy, and added some info of historical big flood data, and plotted a comparison bt. a time span of 70 years and 200 ... so the orange curve is the lazy layman's curve 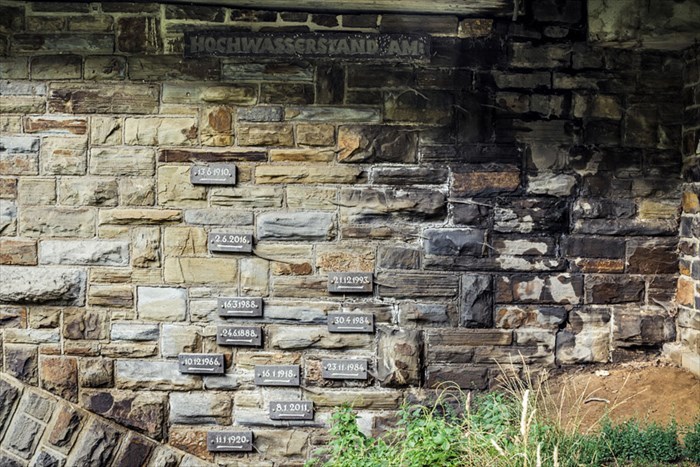 · 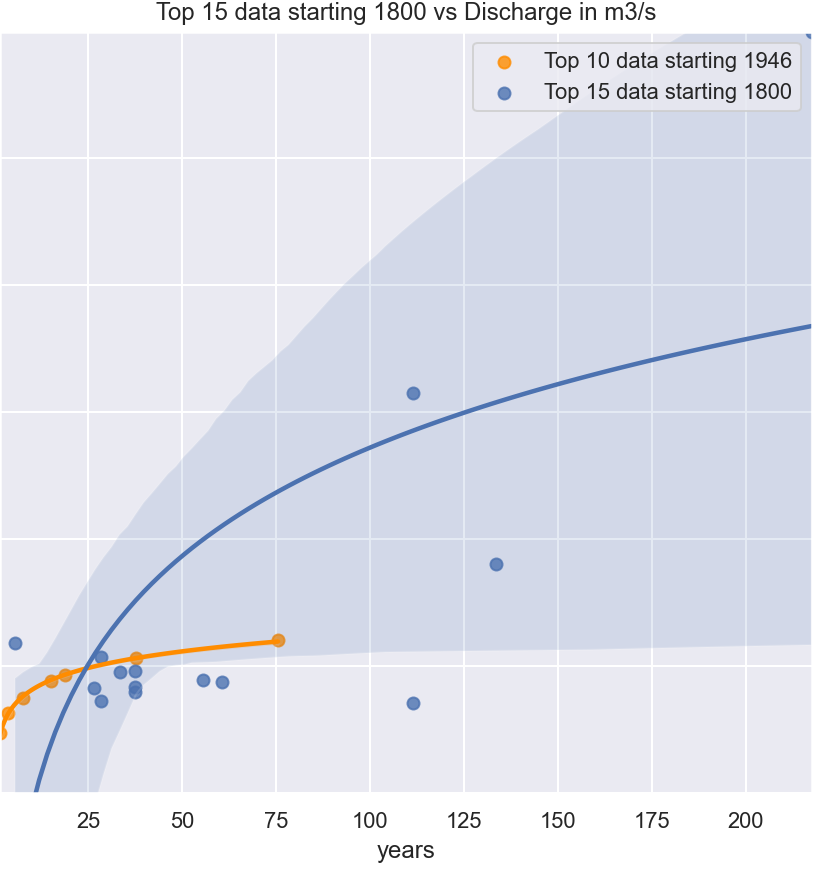 · |
|
#4
●
07-31-2021, 03:43 PM
| ||||||||
| My Rank: MASTER SERGEANT Poster Rank:578 mc² Join Date: Aug 2009 Posts: 1,699 Mentioned: 1 Post(s) Quoted: 299 Post(s)
| ||||||||
|
Re: Recent and Historical Waterlevels Together with the Calculated Discharge
Wellcome to the 3rd floor, sceptics and layman just skip to the last 1 minut Nighty night! |
|
#5
●
08-03-2021, 05:03 PM
| ||||||||
| My Rank: MASTER SERGEANT Poster Rank:578 mc² Join Date: Aug 2009 Posts: 1,699 Mentioned: 1 Post(s) Quoted: 299 Post(s)
| ||||||||
|
Re: Recent and Historical Waterlevels Together with the Calculated Discharge
tx Kelly, The bridge of Rech, which is the only one that survived the 1910 flood, hail these architects, was damaged this time. To my calculations it can pass 440 m³ per second through the 4 gates. But let's say 500m³/s as the 2 middle gates are a bit wider... When I compared the swiftness of the flow in Rech with the assumed broathness 200-225 meters, I get 4600 m3/s. Seeing the debris we get a roughness coefficient of 0.06 going to > 0,15 which translates into 1800 m3/s. Prob. a bit lower, but this makes the flood plain larger... In human words...these soils there can max. infiltrate 22-31 mm/m² daily, so they were saturated, but as 13/07 had already this amount of rain, there was no storage left. It rained 100 to 214 mm/m². I read even 170 to 210 mm in 3 hours in those places. Conclusion: for 1804 a max of 1600 m3/s was estimated by at least 1 historician, with exceptional knowledge and studywork. Not far from my realistic 1800 with debris... Odd thing is when I see the annual max prec., the max of last 30 years on 1 day is 80mm, which is not realistic. But I havent seen the earlier data, yet... |
|
#6
●
08-13-2021, 04:26 PM
| ||||||||
| My Rank: MASTER SERGEANT Poster Rank:578 mc² Join Date: Aug 2009 Posts: 1,699 Mentioned: 1 Post(s) Quoted: 299 Post(s)
| ||||||||
|
Re: Recent and Historical Waterlevels Together with the Calculated Discharge
Recently I heard about a rumour that the district chief - J P - left the crisis centre to move his oldtimer cars out of Bad Neuenahr to safety. As elected political leader his is core member of the crisis staff, which can declare state of emergency in case of emergency like flooding Fact is that he left the crisis team around 18:30-19 pm and returned later so the emergency could only be declared at 23:07 pm. (It seems that since he is in the trirumvirate his vote was needed to declare state of emergency). Other fact is that in the upper valley houses were washed away already, and 1 major water level station broke down (link down) at 18:15. Since 2 weeks there is an investigation (manslaughter / neglect) in course upon him. In the balance lay: 141 deaths, dozens still missing, >10 billion € in damage. I include an extract of the motorclub Sehr geehrte Mitglieder des Ahr-Automobil-Clubs Bad Neuenahr 1924 e.V. im ADAC, liebe Motorsportfreunde, bereits zum 19. Mal führt der Ahr-Automobil-Club Bad Neuenahr die weit über die Kreisgrenzen hinaus bekannte „Ahr-Rotwein- Klassik“ durch. Alle Teilnehmer und motorsportinteressierte Gäste heiße ich in unserem Kreis Ahrweiler herzlich willkommen. Die „Ahr-Rotwein-Klassik“ haben sich zu einer festen Größe im Veranstaltungskalender unseres Kreises Ahrweiler entwickelt. Auch mit der diesjährigen Ausgabe ist der Ahr-Automobil-Club Bad Neuenahr Ausrichter eines Motorsportevents der Spitzenklasse. So bietet die beliebte Old- und Youngtimerfahrt neben einem sportlich ansprechenden Wettkampf gerade auch den vielen begeisterten Zuschauern entlang der Route einen interessanten Einblick in die Fahrzeuggeschichte vergangener Jahrzehnte. Mein Dank gilt an dieser Stelle den Verantwortlichen des Ahr- Automobil-Clubs Bad Neuenahr, die seit vielen Jahren in bewährter Weise dieses beliebte Motorsportereignis auf die Beine stellen. Sie tragen mit großem Engagement und vielen Stunden ehrenamtlichen Arbeitseinsatzes mit dazu bei, das sportliche Geschehen unseres Kreises Ahrweiler um ein weiteres Highlight zu bereichern. Allen Zuschauern wünsche ich bei der 19. „Ahr-Rotwein-Klassik“ erlebnisreiche und aufregende Tage mit viel Spaß und Freude im Kreis Ahrweiler. Den Teams wünsche ich unfallfreie Runden und den sportlichen Erfolg, den sie ansteuern. Bad Neuenahr-Ahrweiler, im Juli 2019 Mit herzlichen Grüßen Ihr Dr. Jürgen Pföhler Landrat des Kreises Ahrweiler |
|
#7
●
08-13-2021, 04:36 PM
| ||||||||
| My Rank: MASTER SERGEANT Poster Rank:578 mc² Join Date: Aug 2009 Posts: 1,699 Mentioned: 1 Post(s) Quoted: 299 Post(s)
| ||||||||
|
Re: Recent and Historical Waterlevels Together with the Calculated Discharge
pics the wooden table tells the story of a flood very much like the one this year: weeks of rain, then a day of torrential downpour in summer the discharge levels of water was +- the same in 1804 and now, but this time the debris clogged the bridges intake much more, piling up bigger impulsing waves...  · 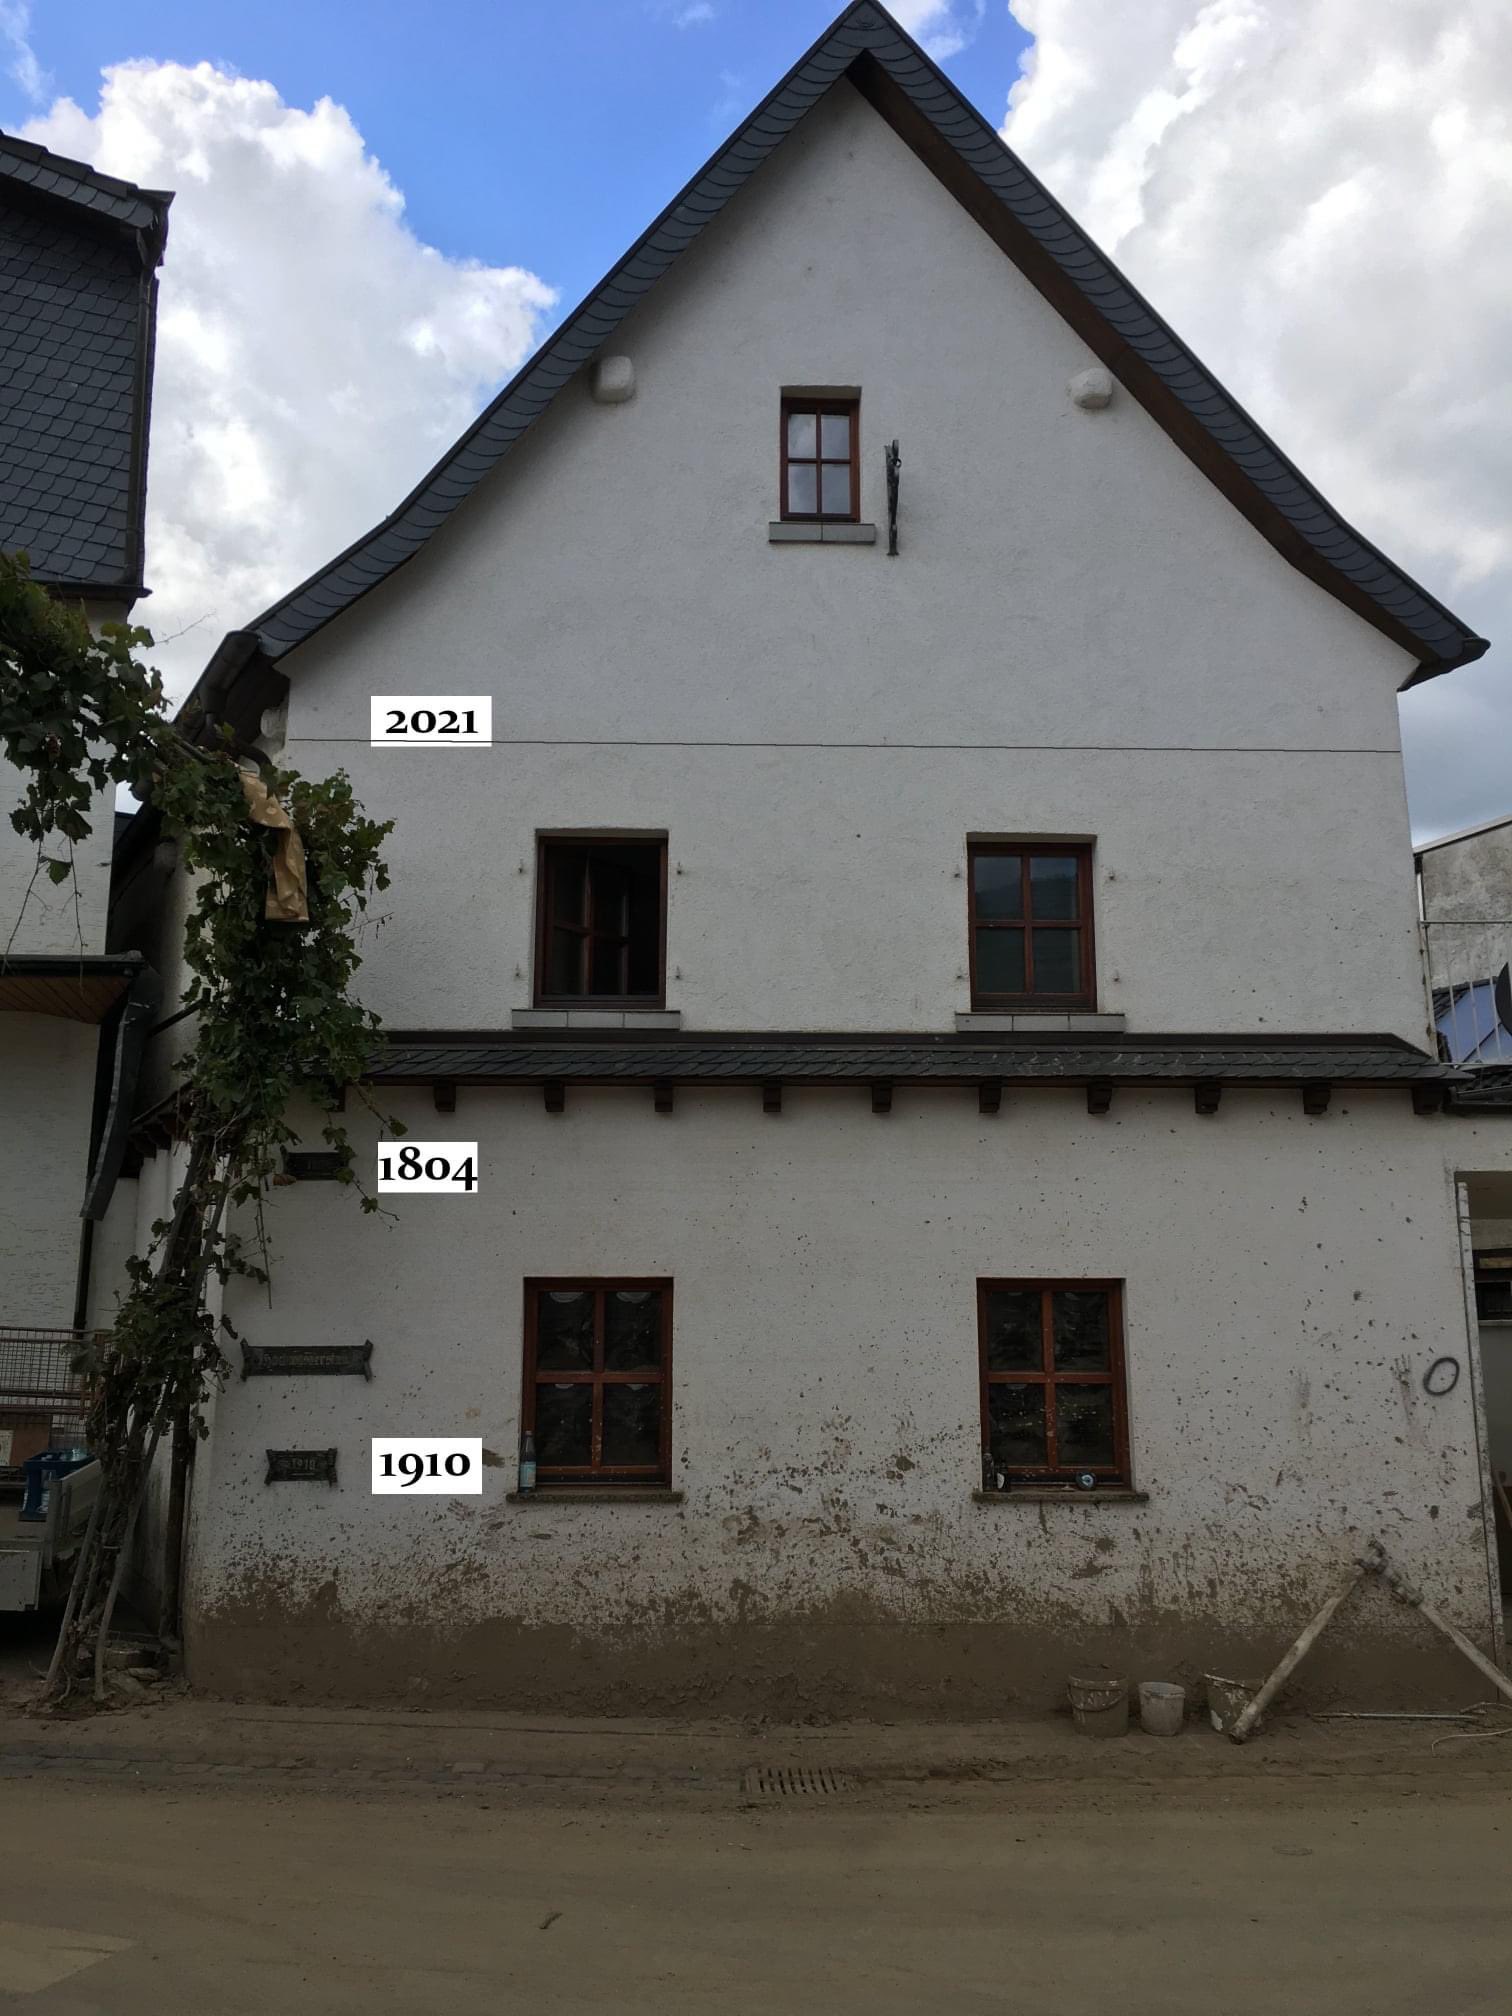 · 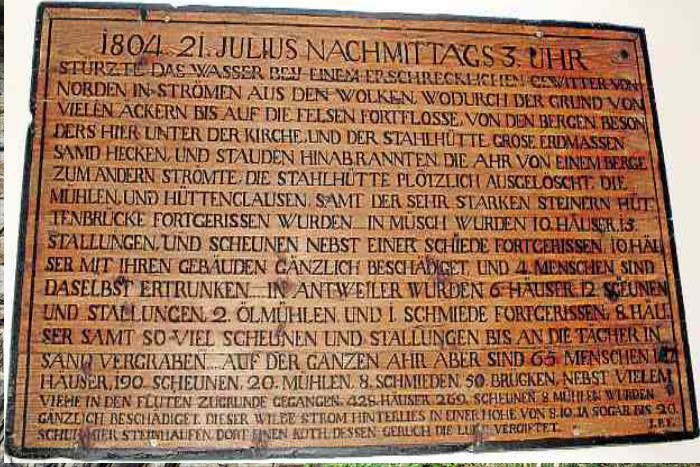 · 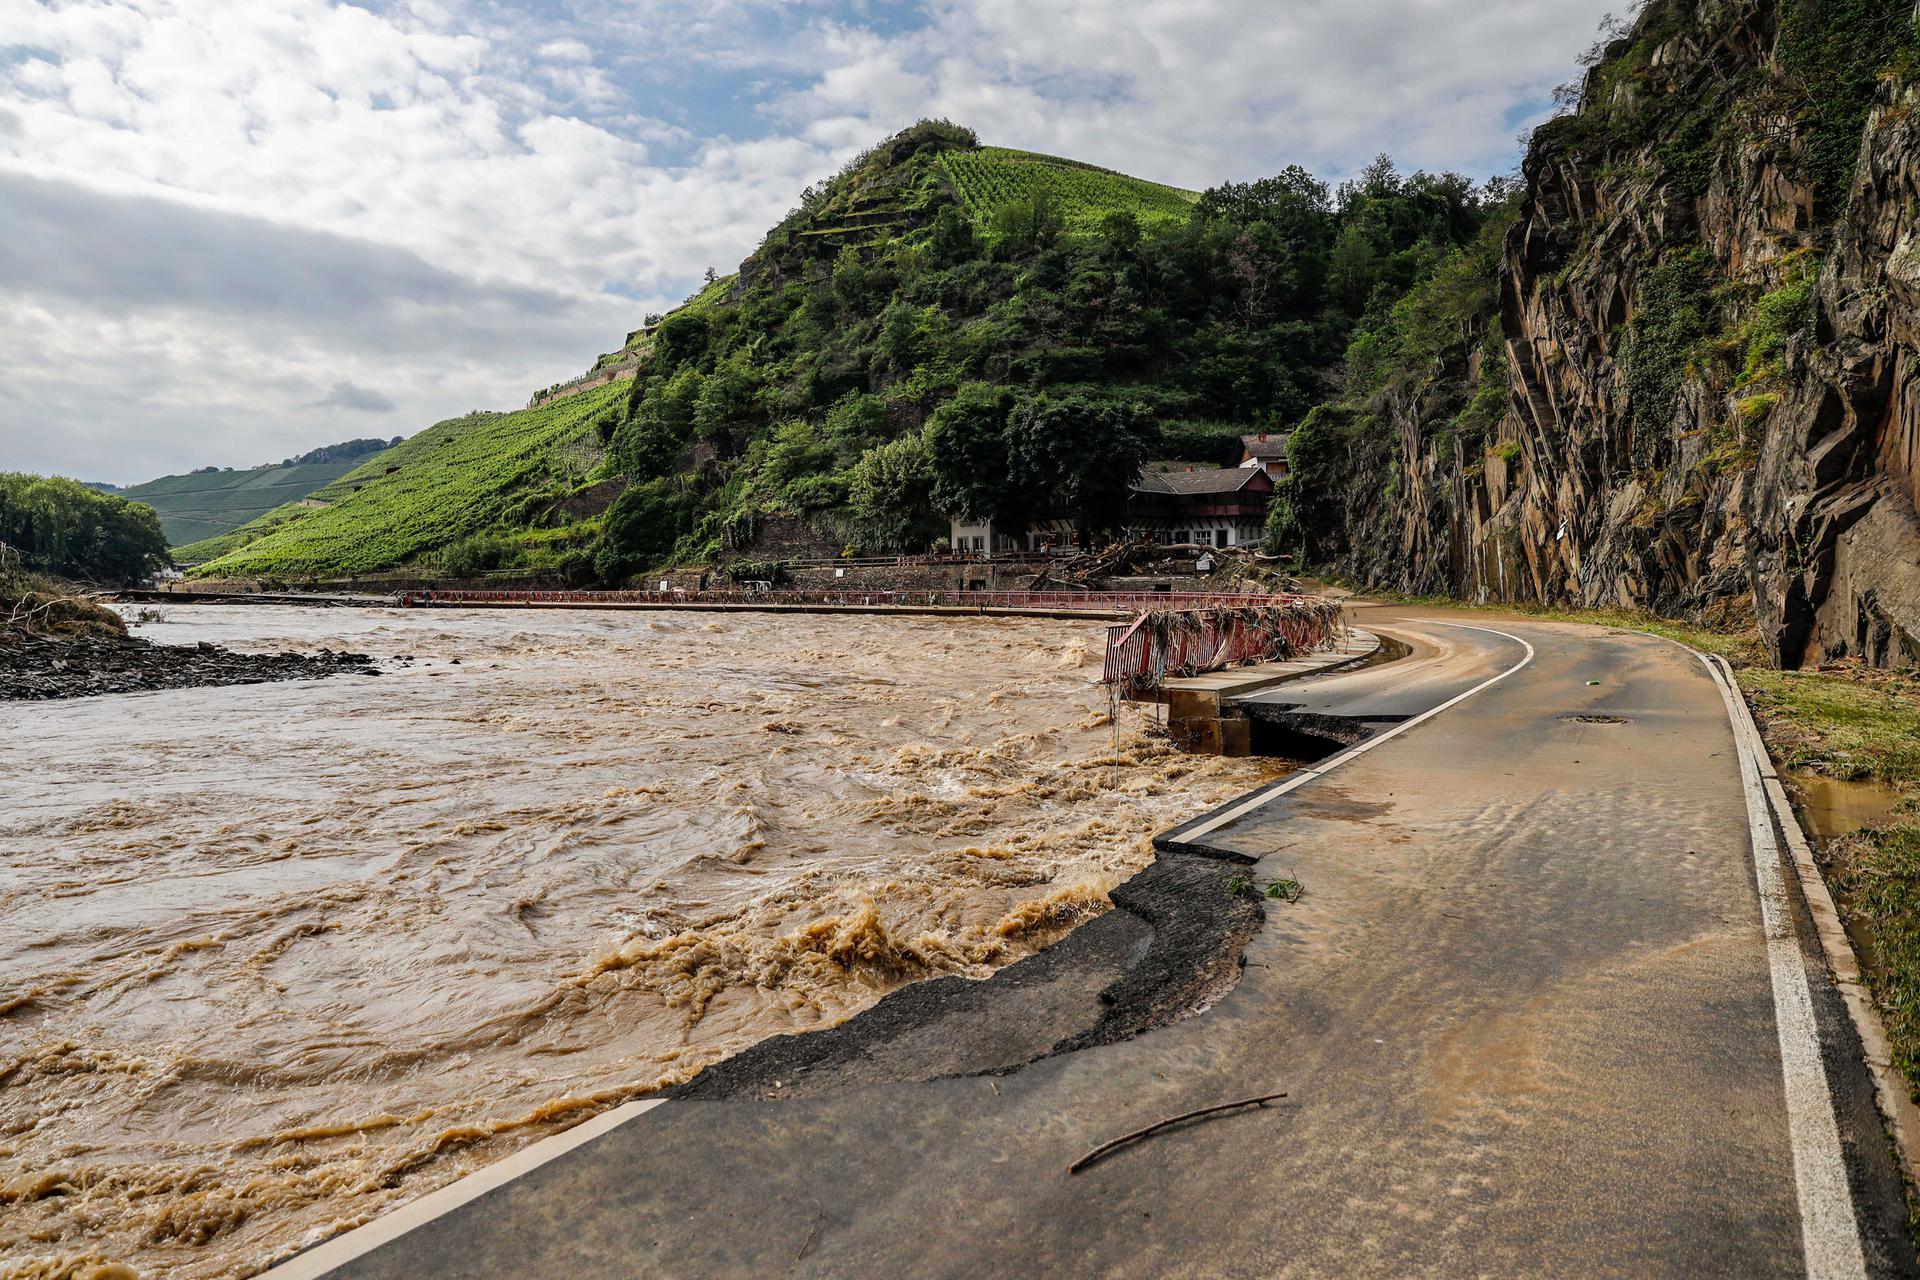 · 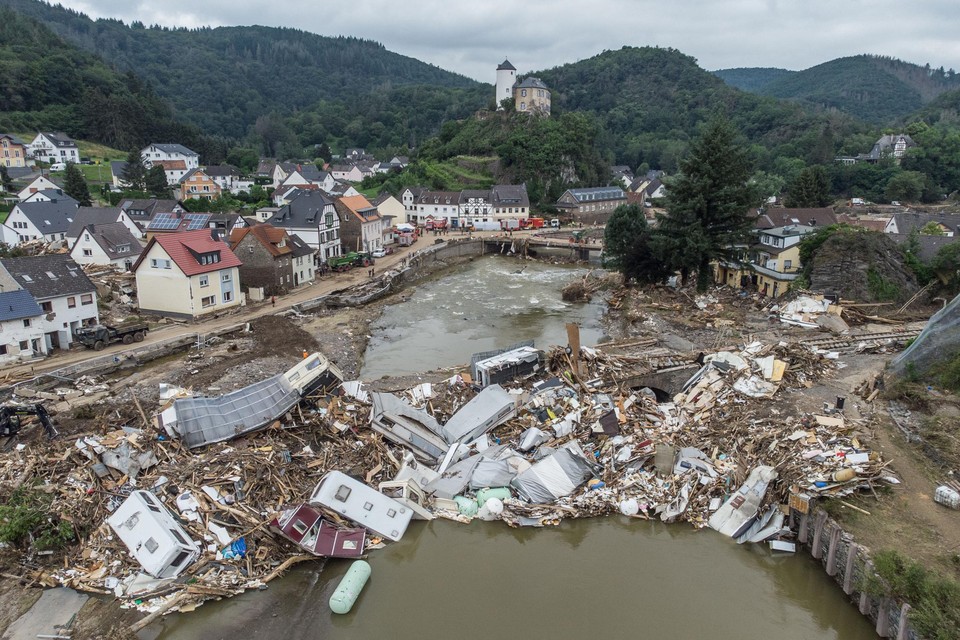 · 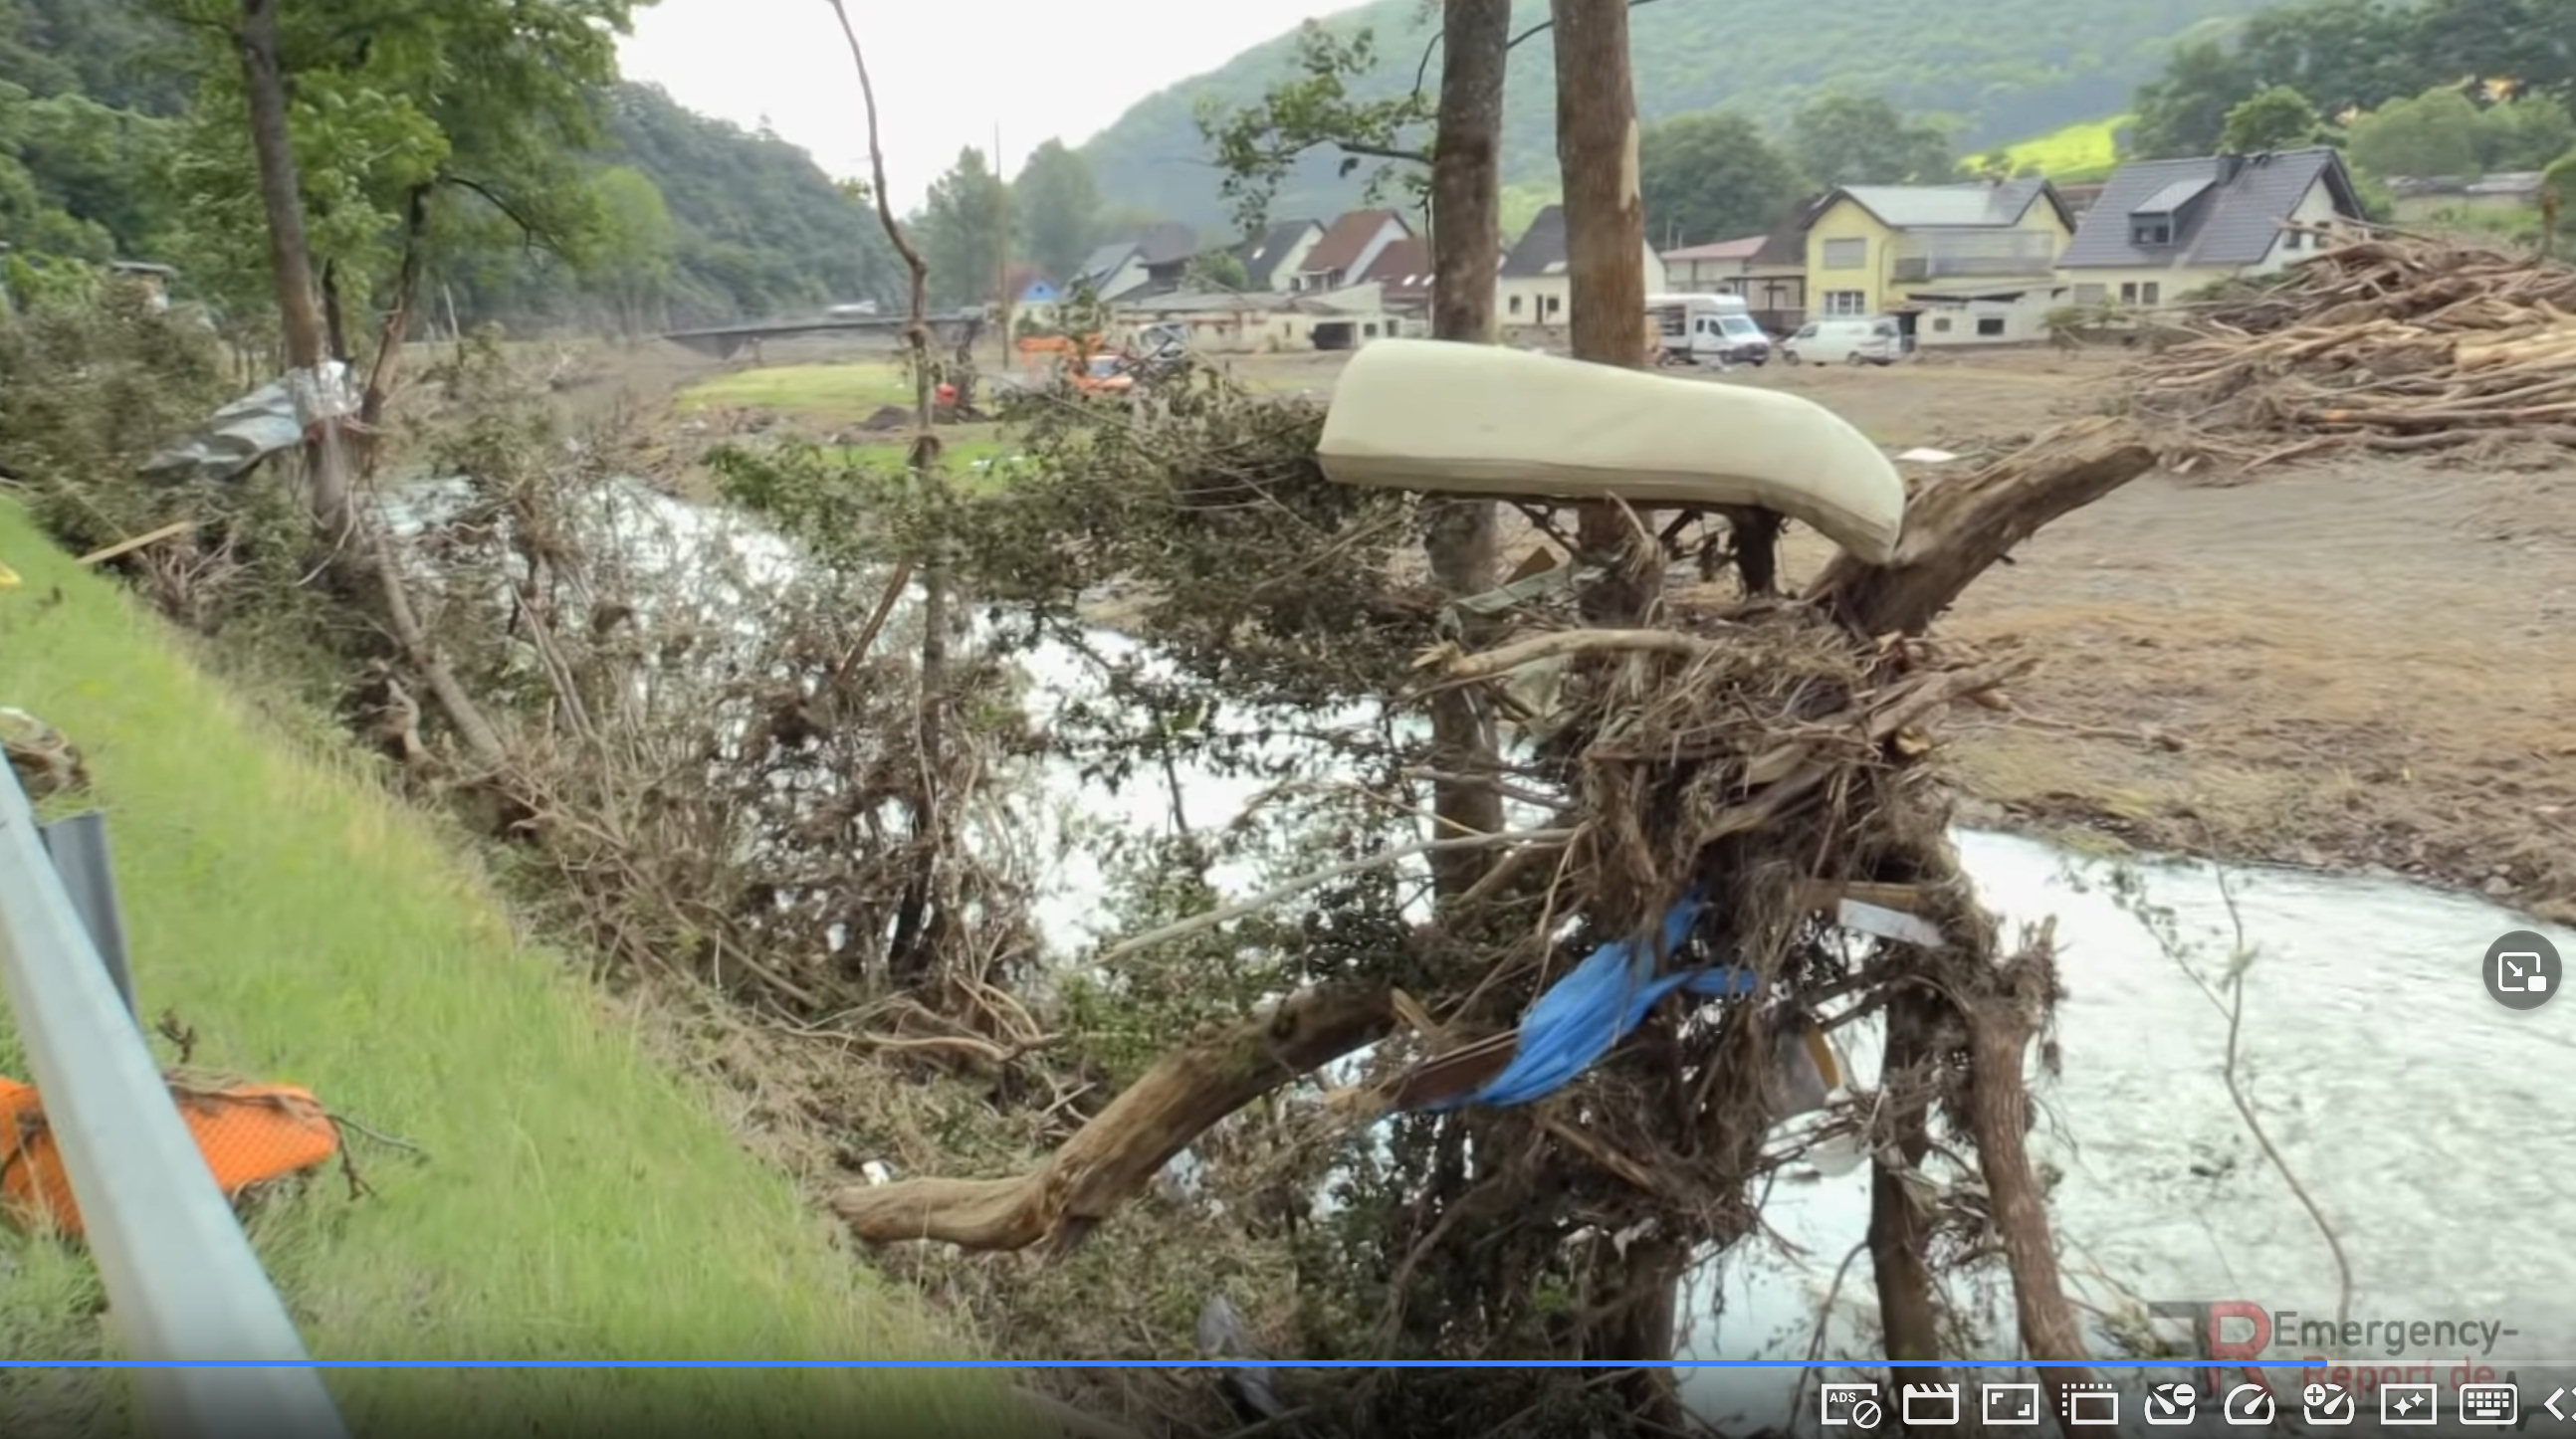 · 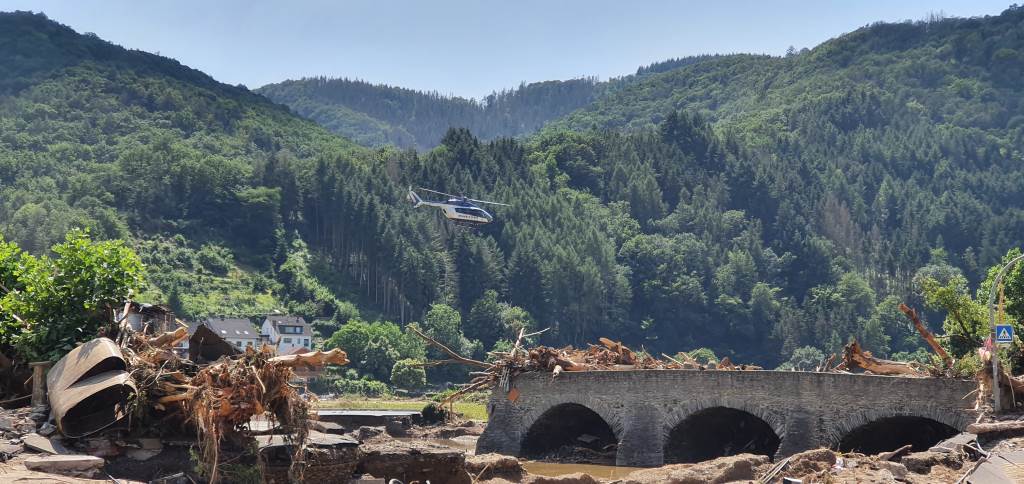 · |
|
#8
●
08-15-2021, 05:22 PM
| ||||||||
| My Rank: MASTER SERGEANT Poster Rank:578 mc² Join Date: Aug 2009 Posts: 1,699 Mentioned: 1 Post(s) Quoted: 299 Post(s)
| ||||||||
|
Re: Recent and Historical Waterlevels Together with the Calculated Discharge
before and after roadshow Mayschoss 14.07.21, ca 22 hr, 3rd floor vid (not the peak level yet!) |
|
#9
●
10-10-2021, 11:31 PM
| ||||||||
 Emperor of Uranus Poster Rank:30 I identify as kitchen ware Join Date: Jan 2017 Posts: 49,600 Mentioned: 28 Post(s) Quoted: 24329 Post(s)
| ||||||||
|
Re: Recent and Historical Waterlevels Together with the Calculated Discharge
This is, BY FAR, the weirdest thread I’ve come across on this site. And that really is saying a lot. So congratulations. Keep up the good work.  |
|
#10
●
10-20-2021, 03:42 PM
| ||||||||
| My Rank: MASTER SERGEANT Poster Rank:578 mc² Join Date: Aug 2009 Posts: 1,699 Mentioned: 1 Post(s) Quoted: 299 Post(s)
| ||||||||
|
Re: Recent and Historical Waterlevels Together with the Calculated Discharge
Yep, that is 1 of the points I'd like to come over to all: we, humans, are not equipped enough to grasp the probability of a disaster occuring. Our emotions get in the way also, but that is another topic... What occured there was a flood event worse than the 'modelled' "100 year flood event". This model was based on data collected less than 40 years old. Thus obsolete! It happened in 1910, so it won't happen again... What does a flood wave look like, plowing through build-up and soon clogged flow storage area? At 500 m³/second? And there is no flood warning service manned after 17:00, cos it is only a small sidestream of the Rhine? |